Friday, June 14, 2024

Homeowner Equity Insights – Q1 2024

Data Through Q1 2024

Introduction: The CoreLogic Homeowner Equity Insights report, is published quarterly with coverage at the national, state and metro level and includes negative equity share and average equity gains. The report features an interactive view of the data using digital maps to examine CoreLogic homeowner equity analysis through the first quarter of 2024.

Negative equity, often referred to as being “underwater” or “upside down,” applies to borrowers who owe more on their mortgages than their homes are worth. Negative equity can occur because of a decline in home value, an increase in mortgage debt or both.

This data only includes properties with a mortgage. Non-mortgaged properties (that are owned outright) are not included.

Homeowner Equity Q1 2024: CoreLogic analysis shows U.S. homeowners with mortgages (roughly 62% of all properties*) have seen their equity increase by a total of $1.5 trillion since the first quarter of 2023, a gain of 9.6% year over year.

*Homeownership mortgage source: 2016 American Community Survey.


Chart 1: U.S. home equity changes year over year, Q1 2024

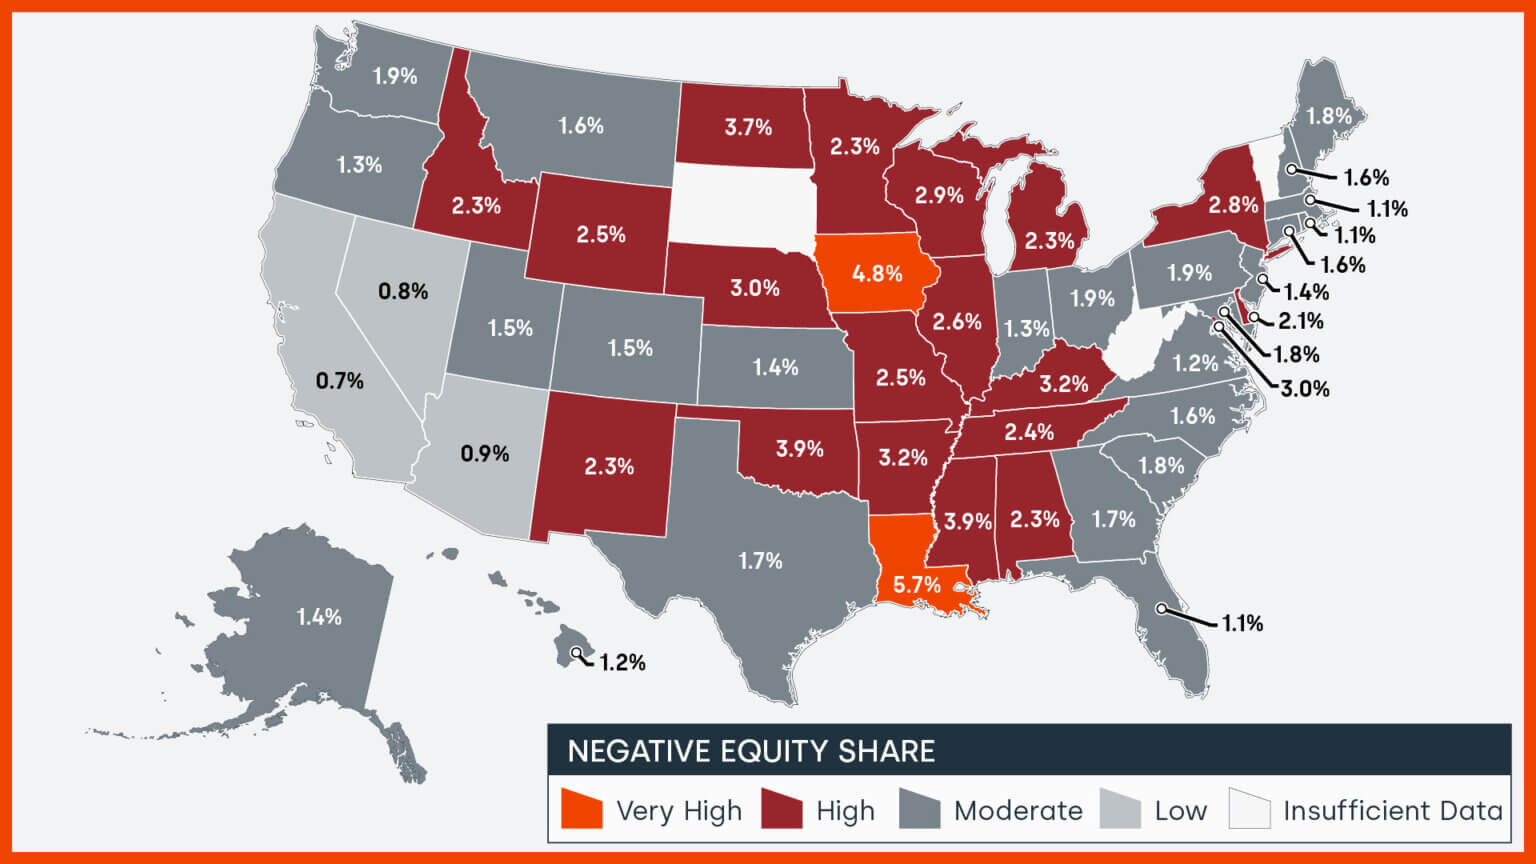
In the first quarter of 2024, the total number of mortgaged residential properties with negative equity decreased by 2.1%  from the fourth quarter of 2023, representing 1 million homes, or 1.8% of all mortgaged properties. On a year-over-year basis, negative equity declined by 16.1% from 1.2 million homes, or 2.1% of all mortgaged properties, from the first quarter of 2023.

Because home equity is affected by home price changes, borrowers with equity positions near (+/- 5%) the negative equity cutoff are most likely to move out of or into negative equity as prices change, respectively. Looking at the first quarter of 2024 book of mortgages, if home prices increase by 5%, 110.000 homes would regain equity; if home prices decline by 5% 153,000 would fall underwater. The CoreLogic HPI Forecast TM projects that home prices will increase by 3.7% from March 2024 to March 2025.


Chart 2: U.S. negative home equity changes year over year, Q1 2024

California Leads U.S. for Annual Equity Gains in Q1

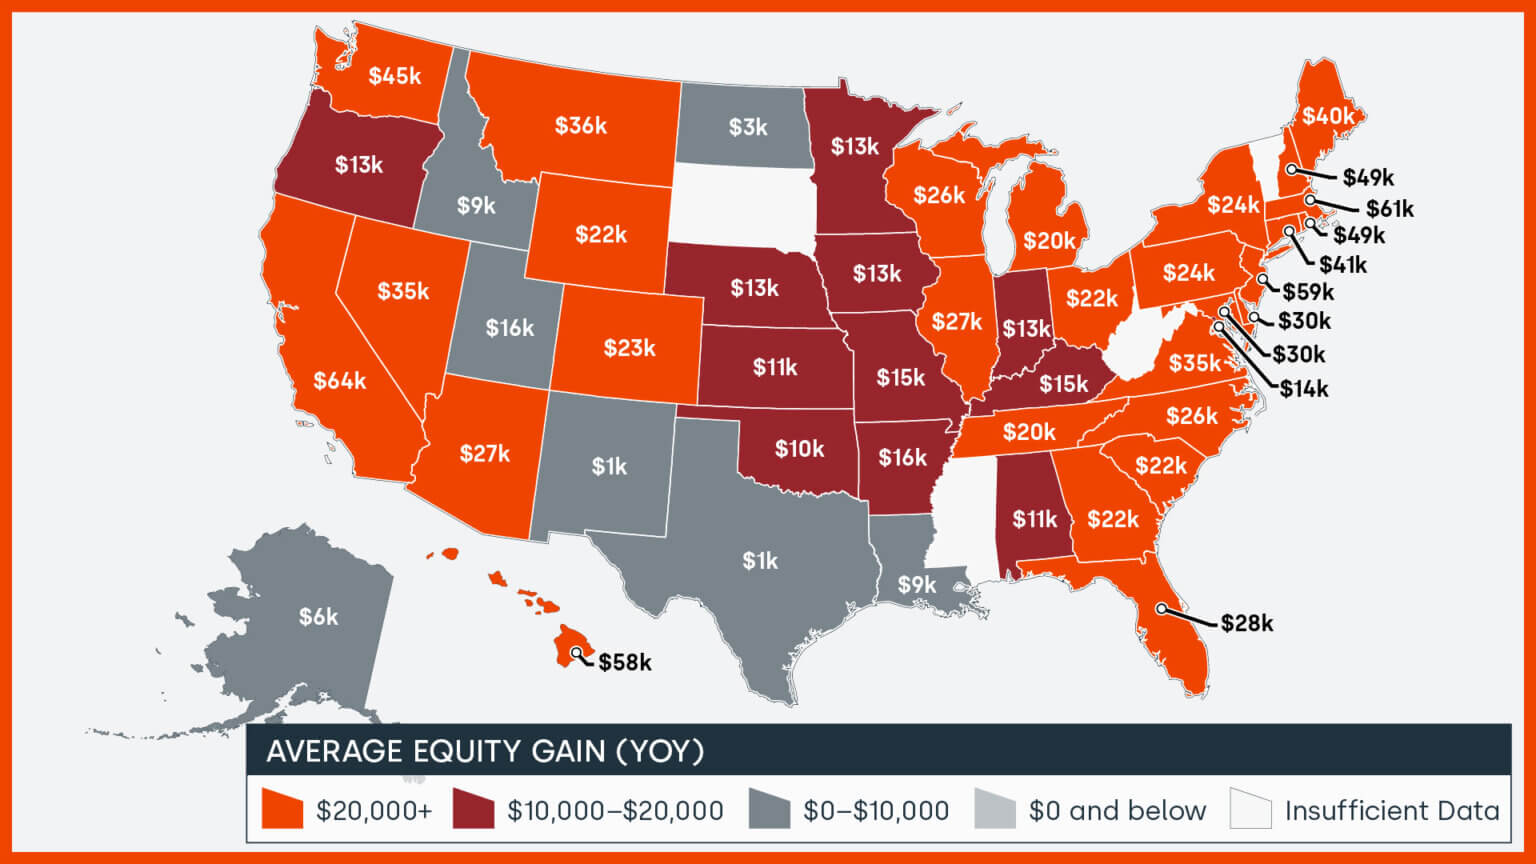
U.S. homeowners with a mortgage continued to see healthy annual equity gains in the opening quarter of 2024. As one of the nation’s most expensive states with perpetually high housing demand, California homeowners saw the largest equity gain in the country at $64,000, with those in the Los Angeles metro area netting $72,000 year over year. Most of the other large equity gains were concentrated in the Northeast, including New Jersey ($59,000), a state that has ranked in the top three for annual appreciation in CoreLogic’s monthly Home Price Insights report since last fall.

National Aggregate Value of Negative Equity: Q1 2024

The national aggregate value of negative equity was approximately $321 billion at the end of the first quarter of 2024. This is down quarter over quarter by approximately $2.8 billion, or 1%, from $324 billion in the fourth  quarter of 2023 and down year over year by approximately $17.6 billion, or 5%, from $339 billion in the first quarter of 2023.

Negative equity peaked at 26% of mortgaged residential properties in the fourth quarter of 2009, based on the CoreLogic equity data analysis which began in the third quarter of 2009.


Chart 3: Negative equity share by U.S. state, Q1 2024

“With home prices continuing to reach new highs, owners are also seeing their equity approach the historic peaks of 2023, close to a total of $305,000 per owner. Importantly, higher prices have also lifted some 190,000 homeowners out of negative equity, leaving only about 1.8% of those with mortgages underwater. Home equity is key to mortgage holders who have seen other homeownership costs soar, including insurance, taxes and HOA fees, as a source of financial buffer. Also, low amounts of negative equity are welcomed in markets that have shown price weaknesses this spring, such as Florida (1.1% of homes underwater) and Texas (1.7% of homes underwater) — both of which are below the national rate — as further price declines could drive more homeowners to lose their equity.”

-Dr. Selma Hepp

Chief Economist for CoreLogic

National Homeowner Equity

In the first quarter of 2024, the average U.S. homeowner gained approximately $28,000 in equity during the past year.

California ($64,000), Massachusetts ($61,000) and New Jersey ($59,000) posted the largest average national equity gains. No states saw annual equity losses.


Chart 4: Average home equity changes by U.S. state year over year, Q1 2024

10 Select Metros Change

CoreLogic provides homeowner equity data at the metropolitan level, in this graphic 10 of the largest cities, by housing stock are depicted. 

Negative equity has seen a recent decrease across the country. Las Vegas is the least challenged, with the negative equity share of all mortgages at 0.6%.


Chart 5: Percentage of homes in negative equity for 10 select U.S. metro areas, Q1 2024

Loan-to-Value Ratio (LTV)

This chart shows National Homeowner Equity Distribution across multiple LTV Segments.

Chart 6: Home equity distribution across multiple LTV segments, Q4 2023 and Q1 2024

Summary

CoreLogic began reporting homeowner equity data in the first quarter of 2010; at that time, the equity picture for homeowners was rather bleak in the United States. Since then, many homes have regained equity and the outstanding balance on the majority of mortgages in this country are now equal to or in a positive position when compared to their loan balance. 

CoreLogic will continue to report on homeowner equity as it continues to adjust in communities and states across the country. To learn more about homeowner equity, visit the CoreLogic Intelligence home page.

Methodology

The amount of equity for each property is determined by comparing the estimated current value of the property against the mortgage debt outstanding (MDO). If the MDO is greater than the estimated value, then the property is determined to be in a negative equity position. If the estimated value is greater than the MDO, then the property is determined to be in a positive equity position. The data is first generated at the property level and aggregated to higher levels of geography.  CoreLogic uses public record data as the source of the MDO, which includes more than 50 million first- and second-mortgage liens, and is adjusted for amortization and home equity utilization in order to capture the true level of MDO for each property. Only data for mortgaged residential properties that have a current estimated value are included. There are several states or jurisdictions where the public record, current value or mortgage data coverage is thin and have been excluded from the analysis. These instances account for fewer than 5% of the total U.S. population. The percentage of homeowners with a mortgage is from the 2019 American Community Survey. Data for the previous quarter was revised. Revisions with public records data are standard, and to ensure accuracy, CoreLogic incorporates the newly released public data to provide updated results.

CoreLogic HPI Forecasts™ are based on a two-stage, error-correction econometric model that combines the equilibrium home price—as a function of real disposable income per capita—with short-run fluctuations caused by market momentum, mean-reversion, and exogenous economic shocks like changes in the unemployment rate. With a 30-year forecast horizon, CoreLogic HPI Forecasts project CoreLogic HPI levels for two tiers — “Single-Family Combined” (both attached and detached) and “Single-Family Combined Excluding Distressed Sales.” As a companion to the CoreLogic HPI Forecasts, Stress-Testing Scenarios align with Comprehensive Capital Analysis and Review (CCAR) national scenarios to project five years of home prices under baseline, adverse and severely adverse scenarios at state, metropolitan areas and ZIP Code levels. The forecast accuracy represents a 95% statistical confidence interval with a +/- 2% margin of error for the index.

Source: The data provided is for use only by the primary recipient or the primary recipient’s publication or broadcast. This data may not be re-sold, republished or licensed to any other source, including publications and sources owned by the primary recipient’s parent company without prior written permission from CoreLogic. Any CoreLogic data used for publication or broadcast, in whole or in part, must be sourced as coming from CoreLogic, a data and analytics company. For use with broadcast or web content, the citation must directly accompany first reference of the data. If the data is illustrated with maps, charts, graphs or other visual elements, the CoreLogic logo must be included on screen or website. For questions, analysis or interpretation of the data, contact Robin Wachner at newsmedia@corelogic.com. For sales inquiries, please visit https://www.corelogic.com/support/sales-contact/. Data provided may not be modified without the prior written permission of CoreLogic. Do not use the data in any unlawful manner. This data is compiled from public records, contributory databases and proprietary analytics, and its accuracy is dependent upon these sources.

About CoreLogic: CoreLogic is a leading provider of property insights and innovative solutions, working to transform the property industry by putting people first. Using its network, scale, connectivity and technology, CoreLogic delivers faster, smarter, more human-centered experiences that build better relationships, strengthen businesses and ultimately create a more resilient society. For more information, please visit www.corelogic.com.

Original Post

Monday, June 10, 2024

US homeowners saw equity soar to near-record highs


According to a new CoreLogic report, the typical homeowner saw their home equity increase by $28,000 over the past year.

This year's record-high home price growth has translated into huge leaps in equity for homeowners. According to a new report from Corelogic, home equity jumped to nearly an all-time high in the first quarter of 2024. 

How much did homeowners gain? Nationally, homeowners saw their equity increase by 9.6% for an average gain of $28,000 from the end of the first quarter of 2023 through the first quarter of 2024. It's the biggest increase since late 2022, Corelogic researchers said. But not all markets are created equal, and homeowners in some areas saw vastly larger gains in their equity. 

The places where home equity has increased the most: The states leading the pack are California, where the typical homeowner's equity increased $64,000 year-over-year; Massachusetts, at $61,000; and New Jersey, at $59,000. Other states with above-average gains include Washington, Maine, New Hampshire and Rhode Island, where equity increased by $40,000 or more in a year. 

In terms of metros, Los Angeles homeowners saw their home equity rise by a remarkable $72,000 year-over-year, while Miami homeowners gained $65,000 and Boston homeowners picked up $61,000. Chicago, Las Vegas and Washington, D.C., homeowners also fared well, seeing equity gains of $32,000 or more. 

What the experts said: The big uptick in equity has been a boon for existing homeowners, especially as the cost of living has increased, said Dr. Selma Hepp, chief economist for CoreLogic. But it's also helped many homeowners who were upside down on their home loan.

"With home prices continuing to reach new highs, owners are also seeing their equity approach the historic peaks of 2023, close to a total of $305,000 per owner," she said. "Importantly, higher prices have also lifted some 190,000 homeowners out of negative equity, leaving only about 1.8% of those with mortgages underwater."

Implications of further home equity gains (or decreases): According to CoreLogic researchers, if home prices increase another 5%, that would lift 111,000 underwater homeowners out of their negative equity situation. On the other hand, if prices were to fall by 5%, 153,000 homeowners would find themselves underwater on their mortgage.

BY: AJ LaTrace

Original PostOriginal Post

Wednesday, May 29, 2024

Fed's Kashkari: 'Many months of positive inflation data' needed before rate cut


Kashkari signaled that the Fed might have to increase interest rates further if inflation does not cool over several months.

Minneapolis Federal Reserve President Neel Kashkari said on Tuesday that he would not support an interest rate cut until there are "many months of positive inflation data."

He said such data would give him "confidence that it's appropriate to dial back."

His comments were made during an interview on CNBC.

He signaled that the Fed might have to increase rates further if inflation does not cool over several months.

“I don’t think we should rule anything out at this point,” he said.

The average 30-year fixed conventional mortgage rate is more than 7%.

Tuesday, May 28, 2024

Home prices continue to reach new highs

The latest Case-Shiller index reported another record high, with U.S. home prices increasing 6.5% year-over-year in March.

U.S. home price growth hit another record high in March according to the latest S&P CoreLogic Case-Shiller data, with prices increasing 6.49% over the last year and up slightly from February. 

What S&P analysts said: "On a seasonal adjusted basis, national home prices have reached their ninth all-time high within the past year, with all 20 metropolitan markets posting positive annual gains for the fourth consecutive month, indicating widespread and sustained growth in the housing sector," said Brian D. Luke, Head of Commodities, Real & Digital Assets at S&P Dow Jones Indices.

"We've witnessed records repeatedly break in both stock and housing markets over the past year," he added.

Continuing growth has pushed national home prices to new highs. NAR reported that April's median existing-home sale price of $407,600 was the highest ever recorded for the month of April, while the median sale price of new homes was $433,500 last month — down from the record high of $460,300 in October 2022, but up roughly $100,000 from pre-pandemic levels.

Which regions are performing the best? Both the 10-city and 20-city indexes have seen big gains in the last year, increasing 8.2% and 7.4% respectively in March. And it's the large population centers that are seeing home prices grow the fastest as the pandemic boomtowns take a back seat. "COVID was a boom for Sunbelt markets, but the bigger gains the last couple of years have been the northern metro cities," Luke said.

Regionally, the Northeast saw the highest annual gain with 8.3% growth, while momentum has slowed in some areas that previously experienced a rapid pace of growth, including Tampa, Phoenix and Dallas. 

Cities with the biggest gains were San Diego (up 11.1%), New York (9.2%), Cleveland (8.8%) and Los Angeles (8.8%). Chicago and Boston were close behind, with both cities posting 8.7% gains.

Monthly growth was more modest at 1.6% overall for the city indexes. Among the metros analyzed, Seattle and San Francisco saw the biggest increases between February and March.

Where prices and inventory are headed: Some housing market economists expect price growth to slow in the coming months, which, combined with improving supply, could offer some relief to buyers. 

"Home inventory increased 23.5% in March, but remained nearly 40% lower than pre-pandemic levels," said Realtor.com Sr. Economist Ralph Mclaughlin. "Existing home sales decreased 4.3% in March following February's large gain. Given the surge in mortgage rates between the end of March and the beginning of May, we expect both home price growth, inventory, and home sales to moderate in future housing market data releases."

High housing costs have become such a big issue that they could play a role in the upcoming 2024 presidential election, Bright MLS Chief Economist Dr. Lisa Sturtevant noted in her analysis of the latest numbers, adding that inventory could remain an issue for some time. 

"Home price growth will likely slow down this summer as mortgage rates remain high, sidelining some prospective homebuyers, while at the same time inventory will be increasing," she said. 

"However, the fundamental gap between demand and supply will remain. Even if Federal policies to increase supply are put into place, the effect will not be immediate. The result is that we are likely to be in a low supply environment through the Presidential election and probably into the next decade."

BY AJ LaTrace

Original Post Original Post

Thursday, May 16, 2024

Your Smart TV Knows What You’re Watching


Here’s how to turn off “automated content recognition,” the Shazam-like software on smart TVs that tracks what you’re watching

If you bought a new smart TV during any of the holiday sales, there’s likely to be an uninvited guest watching along with you. The most popular smart TVs sold today use automatic content recognition (ACR), a kind of ad surveillance technology that collects data on everything you view and sends it to a proprietary database to identify what you’re watching and serve you highly targeted ads. The software is largely hidden from view, and it’s complicated to opt out. Many consumers aren’t aware of ACR, let alone that it’s active on their shiny new TVs. If that’s you, and you’d like to turn it off, we’re going to show you how.

First, a quick primer on the tech: ACR identifies what’s displayed on your television, including content served through a cable TV box, streaming service, or game console, by continuously grabbing screenshots and comparing them to a massive database of media and advertisements. Think of it as a Shazam-like service constantly running in the background while your TV is on.

These TVs can capture and identify 7,200 images per hour, or approximately two every second. The data is then used for content recommendations and ad targeting, which is a huge business; advertisers spent an estimated $18.6 billion on smart TV ads in 2022, according to market research firm eMarketer. 

For anyone who’d rather not have ACR looking over their shoulder while they watch, we’ve put together a guide to turning it off on three of the most popular smart TV software platforms in use last year. Depending on the platform, turning off ACR took us between 10 and 37 clicks.

We recommend updating to the latest version of your TV’s software to ensure instructions are accurate.

Roku

Samsung

LG 

If you recently purchased a new smart TV with ACR that is not on this list, email me at mohamed@themarkup.org. I’m also interested in learning more about readers’ experiences with privacy and advertising on smart TVs.

By Mohamed Al Elew and Gabriel Hongsdusit

Original Post

Thursday, May 2, 2024

Home prices are poised to jump another 5% this year as the market is even tighter than it was in 2023, economist says

Home prices could see another 5% surge in 2024, Capital Economics predicted.

The research firm pointed to home inventory levels, which are still near historic lows.

Low inventory has helped push home prices higher over the last year as demand remains hot.

Home prices could continue to climb this year, as the housing market isn't nearly as loose as prospective homebuyers may think, according to Capital Economics. 

The research firm pointed to the recent uptick in housing inventory, with new listings on the market up 16% compared to levels last year. That's renewed some hope that home prices will eventually come down, or slow their pace of increases, but housing affordability is unlikely to improve, the firm said, forecasting another 5% surge in home prices this year. 

While new listings show a greater number of homes hitting the market, active listings are still around 400,000 short of "normal" levels, Capital Economics estimated, which suggests that an imbalance of supply and demand is still weighing on affordability.

Mortgage rates also remain elevated, with the 30-year fixed rate clocking in at 6.8% the last week, according to Freddie Mac data. High rates have discouraged existing homeowners from listing their properties for sale — and the negative effect that has on inventory will likely continue, Capital Economics said, given that mortgage rates are only expected to ease to around 6.5% by the end of the year. 

"We think that reports of a wave of new resale supply coming onto the market are overblown. While the number of homes being listed for sale has increased compared to last year, it is still low by historical standards, as mortgage rate 'lock-in' continues to curb the number of homes put up for sale. That supports our upbeat call on house prices this year," Thomas Ryan, the firm's property economist, said in a note on Tuesday.

If anything, the housing market looks even "tighter" than it was a year ago, Ryan added. While inventory remains in short supply, the demand for homes has grown hotter, with houses on the market selling three days faster on average than last year, according to Realtor.com data.

Home prices jumped 5.5% in 2023, thanks to a combination of high mortgage rates and low inventory levels. As of February 2024, home prices were already up 6.4% from levels recorded last year, with the median sales price of a home clocking in at over $412,000, according to Redfin. 

"Ultimately the key to a full recovery in existing homes is much lower mortgage rates," Ryan said. "That tight supply paired with a recovery in buyer demand should keep competition for homes strong and support prices."

Other real estate economists have warned housing affordability won't significantly improve for at least the next few years. That's because it will take time to build enough inventory for supply and demand to balance out, experts told Business Insider.

By Jennifer Sor

Original Post

Fed leaves rates unchanged, flags 'lack of further progress' on inflation

WASHINGTON, May 1 (Reuters) - The U.S. Federal Reserve held interest rates steady on Wednesday and signaled it is still leaning towards eventual reductions in borrowing costs, but put a red flag on recent disappointing inflation readings that could make those rate cuts a while in coming.

Indeed, Fed Chair Jerome Powell said that after starting 2024 with three months of faster-than-expected price increases, it "will take longer than previously expected" for policymakers to become comfortable that inflation will resume the decline towards 2% that had cheered them through much of last year.

That steady progress has stalled for now, and while Powell said rate increases remained unlikely, he set the stage for a potentially extended hold of the benchmark policy rate in the 5.25%-5.50% range that has been in place since July.

U.S. central bankers still believe the current policy rate is putting enough pressure on economic activity to bring inflation under control, Powell said, and they would be content to wait as long as needed for that to become apparent - even if inflation is simply "moving sideways" in the meantime.

The Fed's preferred inflation measure - the personal consumption expenditures price index - increased at a 2.7% annual rate in March, an acceleration from the prior month.

"Inflation is still too high," Powell said in a press conference after the end of the Federal Open Market Committee's two-day policy meeting. "Further progress in bringing it down is not assured and the path forward is uncertain."

Powell said his forecast remained for inflation to fall over the course of the year, but that "my confidence in that is lower than it was."

Whether there are rate cuts this year or not remains in doubt.

"If we did have a path where inflation proves more persistent than expected, and where the labor market remains strong but inflation is moving sideways and we're not gaining greater confidence, well, that would be a case in which it could be appropriate to hold off on rate cuts," Powell said. "There are paths to not cutting and there are paths to cutting. It's really going to depend on the data."

Despite the uncertainty of the current economic moment, Powell's characterization of rate hikes as "unlikely" cheered investors concerned about a newly hawkish Fed chief.

U.S. stock and bond prices turned higher as Powell preached patience that may delay rate cuts, but also means a high bar for any more hikes. The Fed raised its benchmark policy rate by 5.25 percentage points in 2022 and 2023 to curb a surge in inflation.

Powell's remarks on Wednesday were "notably less hawkish than many feared," said analysts at Evercore ISI. "The basic message was that cuts have been delayed, not derailed."

Investors in contracts tied to the Fed's policy rate increased bets that rate cuts could begin in September rather than later in the year as reflected in earlier market pricing.

BALANCE SHEET

The Fed's latest policy statement kept key elements of its economic assessment and policy guidance intact, noting that "inflation has eased" over the past year, and framing its discussion of interest rates around the conditions under which borrowing costs can be lowered.

"The Committee does not expect it will be appropriate to reduce the target range until it has gained greater confidence that inflation is moving sustainably towards 2%," the Fed repeated in its unanimously-approved statement.

That continues to leave the timing of any rate cut in doubt, and Fed officials made emphatic their concern that the first months of 2024 have done little to help the cause.

"In recent months, there has been a lack of further progress towards the Committee's 2% inflation objective," the Fed said in its statement.

The U.S. central bank also announced it will scale back the pace at which it is shrinking its balance sheet starting on June 1, allowing only $25 billion in Treasury bonds to run off each month versus the current $60 billion. Mortgage-backed securities will continue to run off by up to $35 billion monthly.

The step is meant to ensure the financial system does not run short of reserves, as happened in 2019 during the Fed's last round of "quantitative tightening."

While the move could loosen financial conditions at the margin at a time when the U.S. central bank is trying to keep pressure on the economy, policymakers insist their balance sheet and interest rate tools serve different ends.

The Fed maintained its overall assessment of economic growth, saying that the economy "continued to expand at a solid pace. Job gains have remained strong and the unemployment rate has remained low."

Powell reconciled that with the relatively weak, 1.6% growth of gross domestic product in the first quarter by saying that the 3.1% increase in private domestic demand was a better gauge of where the economy stands, with output buttressed by a recent jump in immigration.

Asked about the risk the U.S. was entering a period of "stagflation" with stagnant growth and rising prices, Powell said current conditions are nothing like those seen in the late 1970s when prices were rising more than 10% annually at one point alongside high unemployment.

"Right now we have ... pretty solid growth ... We have inflation running under 3%," Powell said. "I don't see the 'stag' and I don't see the 'flation.'"

By Howard Schneider and Ann Saphir

Original Post